
An introduction to MLflow Open Source AI Platform: concepts and capabilities

MLflow has digestible and developer-friendly documentation, yet it can be helpful to understand how each of the core components fit together. In this post, we will discuss the different components that make up MLflow and how they conceptually work together, so you can more easily build up a mental model and afterwards use it for building your own AI applications.
MLflow is a tool that originated in traditional ML to manage the full lifecycle of a machine learning application: from tracking experiments, hyperparameters, and data versions to deploying models and governing them in production. It has since evolved to do something similar for Gen AI applications. This includes evaluation during development, monitoring in production, and tooling for reliability and governance.
I tend to divide it into four distinct blocks:
Evaluation: How do you ensure the agent is of sufficient quality before deployment?
Monitoring: How do you track its quality once it produces real-world behavior in production?
Reliability and governance: How you handle LLM downtime, control costs, and limit the effort required when switching to different LLM providers?
Versioning: How you manage different versions of the agent and prompts, and how you control the promotion lifecycle?
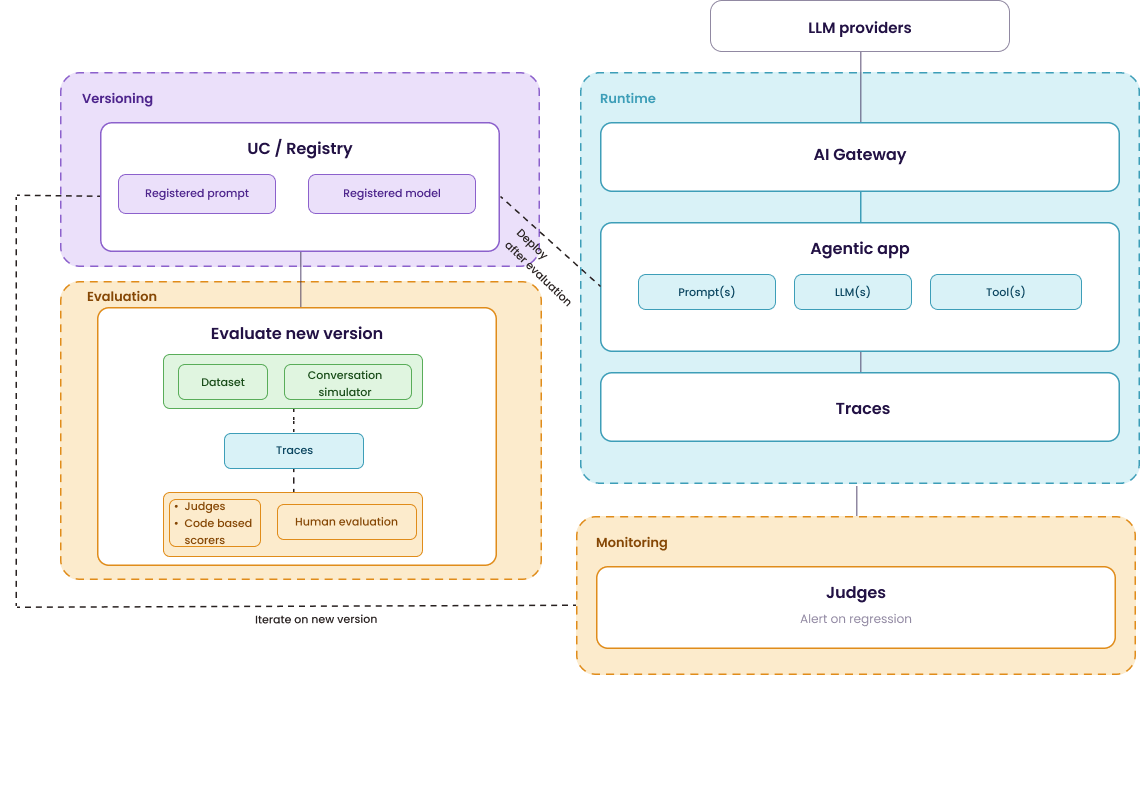
Below is a high-level visual of how these different components work together. We will dive step-by-step into each of them. Use it as a reference point as you read, each section that follows zooms into one or multiple parts of it. By the end of this post, I hope you have a better idea of how the MLflow stack supports the full GenAI lifecycle. Moreover I added references to MLflow documentation and blog throughout the text if you want to dive deeper.
Evaluation and monitoring
Just like in traditional software development, we need to test our application before we move a new version to production. However, this is notably more difficult with agents as they are non-deterministic. During development, you need to test a new version of your agent in a systematic way before you promote it. On the other hand, in production, you need to track whether it’s still behaving as expected once it does.
Both parts rely on the same building blocks: tracing and judges, which will be discussed in the following two sections.
Tracing
Tracing is the first key building block. As I indicated in the visualization above, an agent is essentially (very much simplified) a combination of an LLM, a prompt, and tools. Traces capture how these different components interact every time your agent is used.
It doesn’t just log the basic inputs, outputs, latency, and token counts. It also records information at a much more granular level, every LLM call and every tool invocation, so you can better understand exactly why the output turned out the way it did.
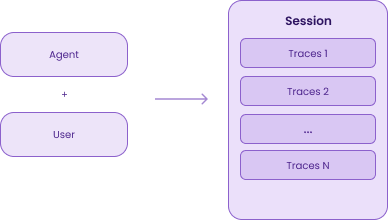
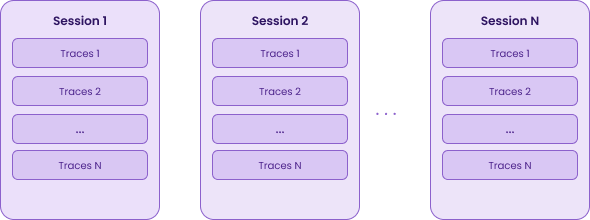
Traces of back-and-forth conversations between a user and an agent can be grouped into sessions; this is what MLflow calls multi-turn conversations. Since users usually require multiple interactions with the agent to solve a problem, sessions are necessary to evaluate the full conversation history rather than just isolated or single-turn messages.
By default, these traces are stored on SQLite database on the MLflow Tracking Server. However, if you use MLflow with Databricks, you can store traces directly in Delta tables in Unity Catalog. This gives you long-term retention, SQL querying, and UC-level access control. This is useful if you need to store a large amount of traces without bumping into the experiment storage limits.
Judges and human evaluation
Logging these traces is a first step, but they aren’t of much value if you can’t use them to make decisions. To turn raw traces into measurable quality, MLflow supports several patterns via Human Feedback and Scorers:
Human Feedback: Domain experts review and label traces. Moreover, they can also add expectations, which is the expected answer. This serves as your “gold standard” or ground truth. While it provides the highest quality data, it is also slow and mostly impossible to scale across all production traffic.
Scorers provide a systematic way to measure performance across different dimensions. There are different types of scorers:
Judges (also called LLM-as-a-judge or agent-as-a-judge): An automated way of evaluating traces. In its simplest form this is actually making use of a LLM to score the output traces of your agent. MLflow supports a set of built-in judges [1], has integrations from third-party packages [2], and lets you build custom ones.
Code-based scorers: Deterministic functions that can be defined with a regular Python function [3].
Human aligned judges: As mentioned earlier, human evaluation gives you the highest quality signal, but it doesn’t scale. Human aligned judges try to overcome this by using a set of human labels to tune the judge’s scoring logic. In the background, MLflow uses frameworks like DSPy (via the SIMBA optimizer) or MemAlign [4] to do that alignment.
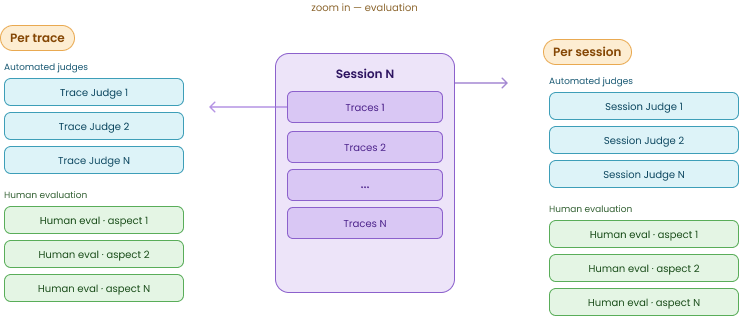
Importantly, both judges and human evaluation can be applied at different granularities: the trace level (individual turns) or the session level (entire multi-turn conversations). This helps you catch different types of errors. For instance, a trace-level judge might validate that a specific tool was called correctly, while a session-level judge is better at detecting overall user frustration, correctness of responses, logical flaw of responses, context retention, or whether the agent actually solved the user’s problem.
Evaluation of a new version
When you have a new version of an agent, you need to know if it actually performs better, or at least hasn’t regressed, before you promote it. To do this, you use the Traces and Scorers we discussed earlier across two different testing patterns: evaluation datasets and dynamic conversation simulations. (See green block within the orange Evaluation block in the first image.)
Evaluation Datasets
For single-turn interactions (one input, one expected output), you can curate traces into a dataset. You have the option to include an Expectation, the “correct” answer, which serves as the ground truth for your scorers. This dataset can change over time, as you keep adding edge cases and failure scenarios you discover. With each new version of your agent, you test against this benchmark.
Conversation simulator
Evaluation datasets work well for single-turn interactions, one input, one expected output. But as we mentioned earlier, a user often interacts with an agent more than once. Take for example a user who can’t reset their password. They would probably need more than one interaction to come to a solution.
Instead of waiting for real users to generate sessions, you define scenarios and let an LLM play the user role automatically [5].
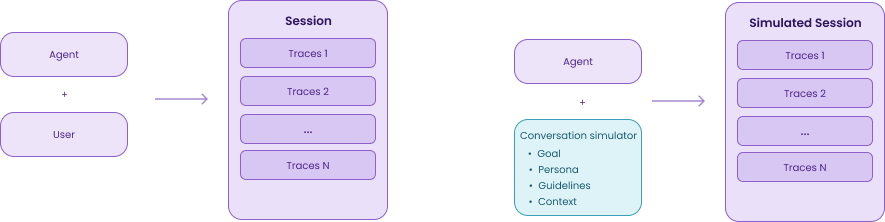
A scenario has four parts:
Goal: what the simulated user is trying to achieve, e.g., “Reset my password”
Persona: how they behave, e.g., “You are a frustrated user who has already tried this three times”
Guidelines: optional constraints, e.g., “Don’t mention email unless the agent asks”
Context: additional parameters passed to your agent function at runtime, e.g., {”user_id”: “user_42”, “plan”: “enterprise”}
MLflow then runs your agent against this simulated user over multiple turns, until the goal is met or the maximum number of turns is reached. This simulated session is traced, similar to a real user session and thus also run the evaluations.
You can test a new agent version before you have production traffic for it. Run the same scenarios against v1 and v2 and compare.
You can extract scenarios from existing production sessions. MLflow uses an LLM to infer the goal and persona from real traces. So over time, your simulation dataset naturally reflects how users actually interact with your agent.
Continuous Online Monitoring
Once your agent is in production you register those same judges. They can automatically run after a trace or session is completed. Alternatively, you can add additional judges, both built-in or custom, to continuously monitor any new traces or sessions in production.
On top of this, you can then set alerts on the scores and investigate when something gets flagged. A drop in groundedness, a spike in user frustration are, for example, important indications that there is a need for a new iteration. Of course, you can also monitor the traditional metrics like latency, token usage and error rates.
Reliability and Governance: AI Gateway
Evaluation and monitoring handle quality. But what about reliability and governance?
One of the components of an agent we mentioned earlier is the LLM(s) it uses, as a judge or to complete a task Often these are externally hosted models called through an API. The AI Gateway sits between your agent and these external providers [6]. That is also where it appears in the first diagram.
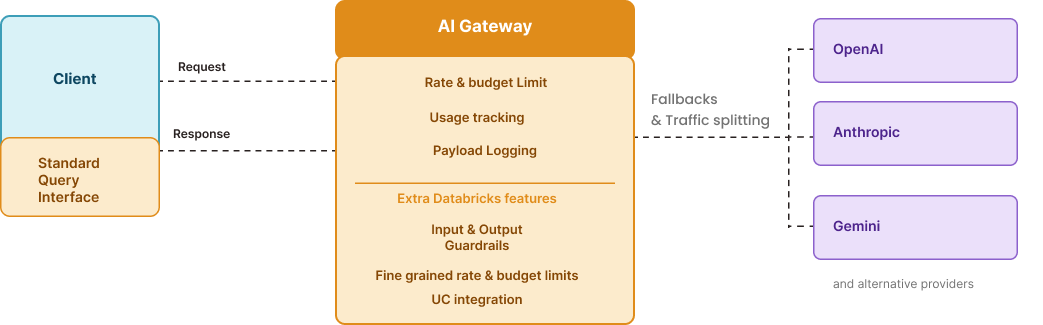
It gives you:
One interface: You get one standard interface for all providers. If you want to switch from OpenAI to Anthropic, you just change a config file, your agent’s code stays exactly the same.
Rate limiting: You can set limits on usage to prevent unexpected costs [7]. While the open-source version focuses on endpoint-level limits, the Databricks version allows you to set these limits at the individual user or group level (e.g., the “Marketing Team” gets a different budget than “Finance”).
Automatic fallbacks and traffic splitting: You can define “failover” chains so that if your primary provider is down, the gateway automatically routes the request to a backup. You can also split traffic for A/B testing.
Tracing: of every request that passes through the gateway.
I mentioned the Databricks version of the AI gateway earlier, it is basically the “managed” version of the open-source MLflow gateway. In addition to not needing to host it yourself, the Databricks version adds features like Guardrails for built-in PII masking and safety filters that sit on both sides of the gateway, and Unity Catalog integration for all logs.
Versioning
Agentic applications aren’t a piece of software you can deploy and forget. You’ll go through many iterations: think about tweaking prompts, updating retrieval logic, swapping models and more. Governance is how you keep track of what changed, what’s currently running, and how to roll back if something breaks.
Every version you want to compare or promote can be logged to the model registry. You can package it as an artifact that captures the agent’s code, dependencies, the exact prompt version it used, and links to the traces generated during evaluation.
Next to the Model Registry, there’s a Prompt Registry, prompts are versioned independently from model code. MLflow also offers a built-in diff view to compare prompt versions side by side. This is something we already have through git, right? That was my first reaction, and apparently a common one, since the MLflow docs address it directly. It does make sense though. Keeping the prompt in the same place where you trace and evaluate your agent makes it much easier to see how prompt changes impact your results. Think of it like tracking hyperparameters in MLflow for traditional ML.
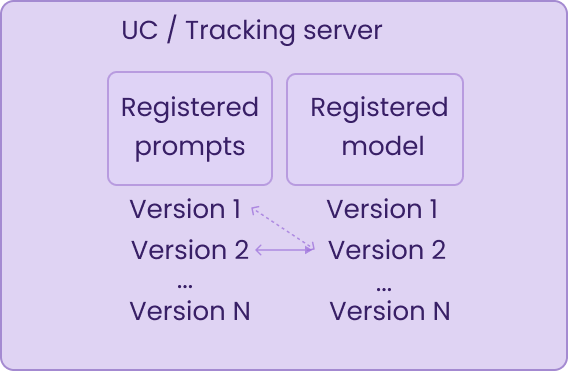
In the Model Registry you can also manage which version is actually running where. You can assign human-readable labels to specific versions for example, marking one as champion to indicate it’s the current production model, or challenger for a version you’re testing against it. When you’re ready to promote, you move the label.
On Databricks, both the registered model and prompts are governed through Unity Catalog. Without Unity Catalog, you fall back to the open-source MLflow Model Registry, you still get versioning and promotion labels, but without the fine-grained access control Unity catalog brings.
Conclusion
Now we discussed all the concepts, you can start implementing this in your own agentic applications. If your current setup is just basic logging of inputs and outputs, start with adding traces. That’s how you get insights into what your agent actually does at runtime.
After that, add evaluation before you deploy a new iteration, so you know whether quality improved and there were no regressions. Monitoring follows naturally from there. The AI Gateway and versioning can come as two separate improvements afterwards.
The MLflow documentation has great examples to help you get started with all the components we discussed.